Jordan Foster · 17 October 2026
Volunteers Track Retail Evolution Through Seasonal Market Observations and Pedestrian Counts
Community volunteers across multiple regions have taken on systematic collection of seasonal market activity and foot traffic metrics to reveal how commercial districts respond to changing consumer habits, weather cycles, and economic pressures, and their efforts produce datasets that local planners and business associations now reference when adjusting store hours or planning events.
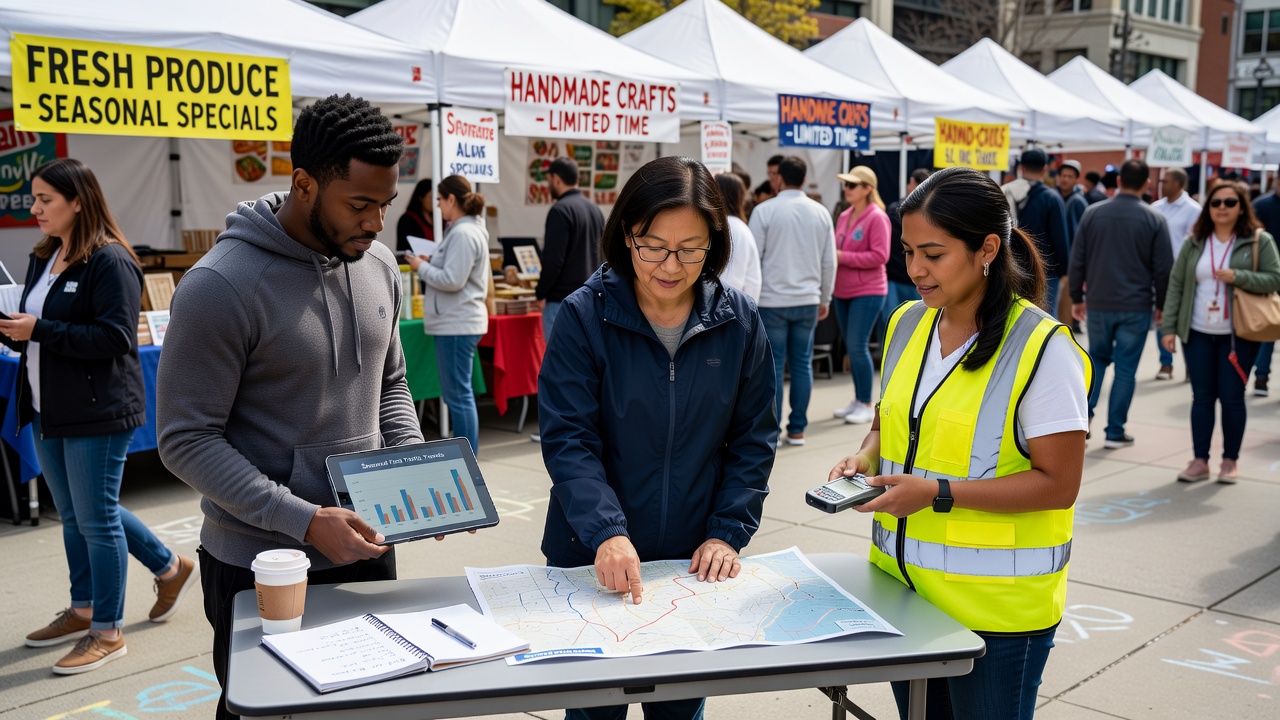
Teams typically divide into shifts that cover morning setup at farmers markets, midday sidewalk counts along main streets, and evening tallies near transit hubs, while they log variables such as vendor density, average dwell time, and directional flow using standardized apps that timestamp each observation, and these protocols allow aggregation across weeks rather than isolated snapshots.
Data Collection Methods in Practice
Volunteers receive brief training on consistent counting zones and weather notation before heading out, then they record pedestrian numbers at fixed intervals while noting nearby events like festivals or road closures that might skew numbers, and the resulting spreadsheets feed into shared dashboards where patterns emerge over successive seasons. One group operating in the Pacific Northwest documented a 22 percent rise in weekend foot traffic near breweries during autumn harvest months, whereas downtown core counts stayed flat, and similar projects in coastal Australia have cross-checked their figures against national retail sales reports released by the Australian Bureau of Statistics.
Equipment stays simple: clipboards or tablets, reflective vests, and portable counters, yet the accumulated records now span multiple years in several towns and cities, which lets analysts compare October 2026 numbers against the same period in prior years to isolate effects from new transit lines or shifting work-from-home patterns.
Seasonal Patterns Emerging from the Records
Spring data sets frequently show spikes around outdoor market openings, while summer tallies capture longer evening strolls when temperatures stay mild, and winter observations highlight indoor corridor usage in shopping centers that replace street-level movement once snow arrives. Researchers at several universities have begun incorporating these volunteer logs into broader studies on urban vitality, noting correlations between sustained foot traffic and lower retail vacancy rates over time.
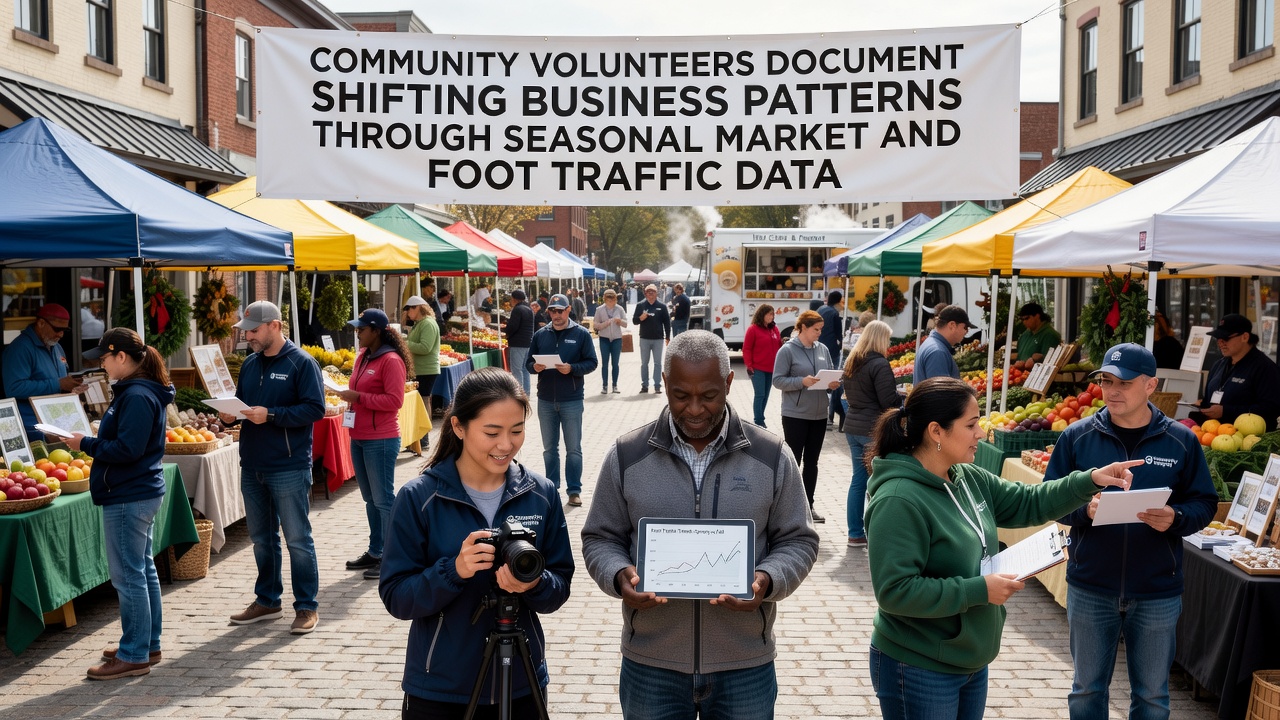
Business owners receive anonymized summaries that highlight peak hours for their block, and several have adjusted staffing or extended pop-up hours based on those trends, while city economic development offices use the same numbers to justify targeted lighting upgrades or signage improvements. Data from the US Census Bureau's retail trade surveys provides context for national shifts, yet the hyper-local volunteer counts fill gaps that quarterly aggregates cannot address.
Broader Applications and Comparisons
Groups in European cities have adapted similar protocols to monitor pedestrian zones after new bike lanes opened, and their reports feed into municipal planning documents alongside Eurostat mobility statistics. In Canada, parallel efforts near transit stations have helped quantify how seasonal market days influence nearby café revenues, according to summaries shared by Statistics Canada. These cross-regional comparisons reveal that towns maintaining consistent volunteer programs detect early signs of retail clustering sooner than those relying solely on permit records.
Training materials emphasize neutrality, so counters avoid interpreting why numbers rise or fall and instead focus on accurate logging, and periodic audits by university partners confirm that inter-rater reliability stays above 90 percent when clear zone maps are used. The approach costs little beyond volunteer time and basic devices, which makes it replicable even in smaller communities that lack dedicated research staff.
Conclusion
Volunteer-driven seasonal data collection continues to expand as more neighborhoods recognize its value for understanding commercial rhythms, and the resulting archives now serve as reference points for both immediate business decisions and longer-term urban planning. As October 2026 approaches, additional teams are preparing to repeat their routes, adding another layer to records that already span several years and multiple climate zones.